660

%

Operational reporting prep time across product teams

660

%

Operational reporting prep time across product teams

400

K

hrs

Hidden workflow friction exposed through behavioral instrumentation

400

K

hrs

Hidden workflow friction exposed through behavioral instrumentation

900

%

Cost reduction ($500K → 50K) for behavioral analytics/team

900

%

Cost reduction ($500K → 50K) for behavioral analytics/team

Confidentiality Notice

My work at FINRA was focused on highly sensitive market surveillance and privacy initiatives. To comply with strict non-disclosure agreements, all proprietary data, live interfaces, and specific workflows have been omitted. This case study focuses exclusively on high-level strategy, organizational architecture, and publicly communicable outcomes.

Challenge

Fewer than 10% of FINRA's products had behavioral data. The ops, security, and QA data that existed was siloed and unreachable.

Stragegy

I rolled out Pendo across the company, then built an analytics center of excellence to help teams ask better product questions. To break down silos, I created a shared operational dashboard that combined OPS, QA, Security, and behavioral analytics into a single view.

Results

Time preparing data for reporting dropped 66%. The platform cut resource-finding time 60% and delivered $1.9M in year-one efficiencies.

Challenge

Siloed insights, siloed decisions

PMs and leads spent 6 hrs/wk gathering data and locating decision-makers, which meant linking dashboards, emailing committees, and reading technical WIKIs.

Data fluency varied by team. The result: duplicated work, SME-related friction, and rogue projects.

Challenge

Siloed insights, siloed decisions

PMs and leads spent 6 hrs/wk gathering data and locating decision-makers, which meant linking dashboards, emailing committees, and reading technical WIKIs.

Data fluency varied by team. The result: duplicated work, SME-related friction, and rogue projects.

240

hrs/mon

Avg. time spent preparing operational reporting data

240

hrs/mon

Avg. time spent preparing operational reporting data

300

min/task

Avg. time spent locating dependencies and ownership data

300

min/task

Avg. time spent locating dependencies and ownership data

580

%

Teams reporting fragmented operational visibility

580

%

Teams reporting fragmented operational visibility

strategy

Reduce organizational friction by helping teams ask better questions

Journey mapping and JTBD interviews with 60 PMs showed that roughly 70% of analytics needs were the same. Most “special cases” turned out to be reporting variations or gaps in analytics fluency. Instead of spending a year building hundreds of custom Power BI dashboards, I standardized approvals and review workflows first.

strategy

Reduce organizational friction by helping teams ask better questions

Journey mapping and JTBD interviews with 60 PMs showed that roughly 70% of analytics needs were the same. Most “special cases” turned out to be reporting variations or gaps in analytics fluency. Instead of spending a year building hundreds of custom Power BI dashboards, I standardized approvals and review workflows first.

Example customer journey map showing how data was collected and used.

key trade-off

Customization vs. standardization

The challenge

Funding depended on PMs getting sprint approvals through multiple review committees. Expectations constantly changed, so approvals often dragged on for 3+ months and several review rounds.

Behavioral analytics were especially fragmented: two teams spent more than 6 months and $500K building custom dashboards, yet only 2 of 65 products developed them.

Custom Data Views

What PMs asked for: custom charts and filters. Most requests focused on low-value metrics, reinforced existing analytics gaps, and created long-term engineering overhead.

Standardized Dash

What the research supported: prebuilt approval and portfolio views that standardized decision-making and scaled quickly across teams.

Standardized Dash

What the research supported: prebuilt approval and portfolio views that standardized decision-making and scaled quickly across teams.

My decison

I standardized workflows and reporting first, betting analytics needs would naturally converge as teams became more fluent with the data.

Results

Within 4 months, approval prep dropped from 6 hours to 2 per week, and approval cycles fell from 3 months to 8 weeks.

Requests for custom dashboards declined as teams matured.

Phase 1

Make approval data easy to find and easy to reuse

What Phase 1 solved

  • A single, always-current place to find services, dependencies, and support contacts

  • Standardized, copy-ready metrics for approvals and weekly reporting

Phase 1

Make approval data easy to find and easy to reuse

What Phase 1 solved

  • A single, always-current place to find services, dependencies, and support contacts

  • Standardized, copy-ready metrics for approvals and weekly reporting

How we built it

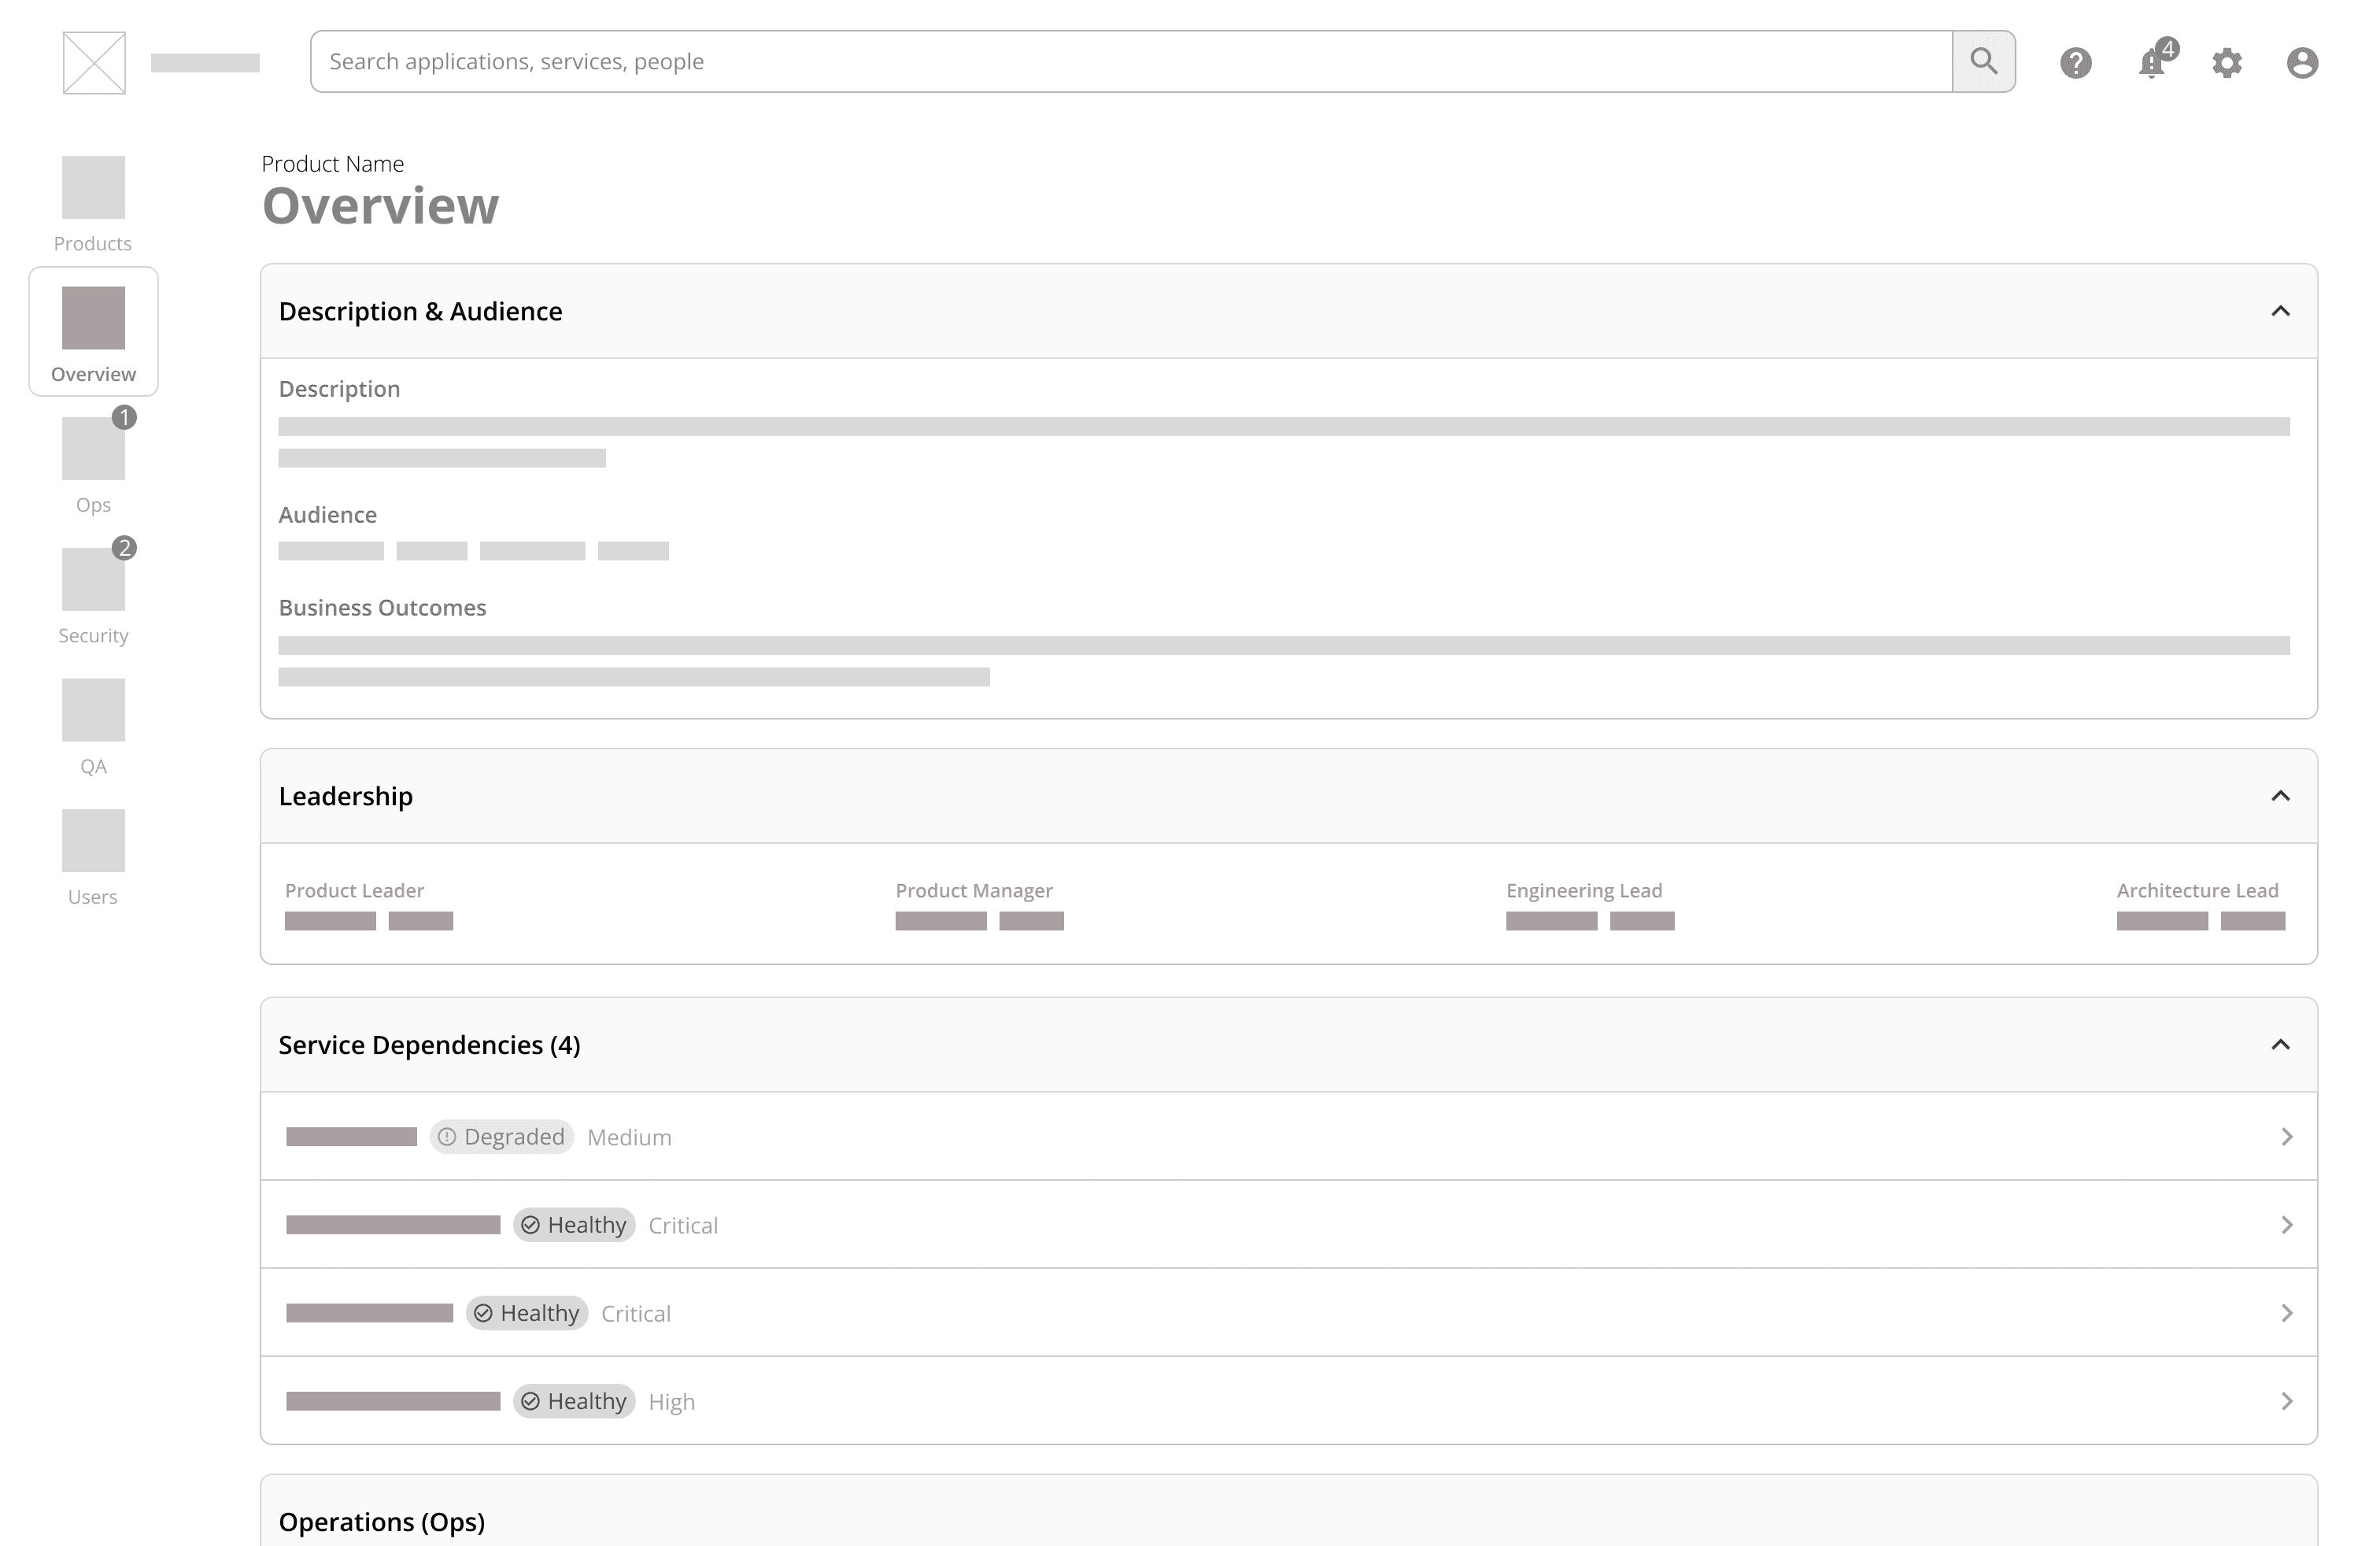
Engineering centralized analytics into a shared data lake so teams could connect operational events with downstream impacts, like support spikes caused by outages.

To move quickly, I designed a lightweight SaaS interface with embedded Power BI elements. It was intentionally simple, but fast enough to validate usage patterns and build support for adopting Pendo.

How we built it

Engineering centralized analytics into a shared data lake so teams could connect operational events with downstream impacts, like support spikes caused by outages.

To move quickly, I designed a lightweight SaaS interface with embedded Power BI elements. It was intentionally simple, but fast enough to validate usage patterns and build support for adopting Pendo.

Results

PMs reported saving roughly 4 hours per week preparing approval and reporting data. Average approval cycles dropped from 3 review rounds to 2.

Results

PMs reported saving roughly 4 hours per week preparing approval and reporting data. Average approval cycles dropped from 3 review rounds to 2.

240
80

hrs/mon

Avg. time spent preparing operational reporting data

240
80

hrs/mon

Avg. time spent preparing operational reporting data

300
110

min/task

Avg. time spent locating dependency and ownership data

300
110

min/task

Avg. time spent locating dependency and ownership data

580
250

%

Teams reporting fragmented operational visibility

580
250

%

Teams reporting fragmented operational visibility

Phase 1

Hypothesis-driven design

For each touchpoint, I implemented a rigorous testing and validation process. Leveraging theory from fields including Cognitive, Behavioral, Gestalt, Behavioral, and Attention/Perception Psychology, nearly every aspect of the design was treated as a testable hypothesis. From the content itself to the treatment, nothing went unscrutinized.

Phase 1

Hypothesis-driven design

For each touchpoint, I implemented a rigorous testing and validation process. Leveraging theory from fields including Cognitive, Behavioral, Gestalt, Behavioral, and Attention/Perception Psychology, nearly every aspect of the design was treated as a testable hypothesis. From the content itself to the treatment, nothing went unscrutinized.

Low fidelity mock of the product analytics

Example customer journey map showing how data was collected and used.

Why the duck?

FINRA ran dry and task-focused. Tensions were high as teams realized my launch of behavioral analytics would surface workforce behavior data.

My hypothesis: If a low-threat, incongruous stimulus preceded the first dashboard, audience anxiety would decrease and receptivity to the data would increase. I tested crates, construction workers, and a haiku across 25 people. The duck won, and went viral. It even ended up on the executive deck for the Creatathon.

Why the duck?

FINRA ran dry and task-focused. Tensions were high as teams realized my launch of behavioral analytics would surface workforce behavior data.

My hypothesis: If a low-threat, incongruous stimulus preceded the first dashboard, audience anxiety would decrease and receptivity to the data would increase. I tested crates, construction workers, and a haiku across 25 people. The duck won, and went viral. It even ended up on the executive deck for the Creatathon.

Low fidelity mock of the product analytics

Example of the whimsical imagery used to diffuse the anxieties teams felt during the transition.

Phase 2

Scaling personalization with AI

Phase 1's success brought new challenges: how to scale our source of truth without additional headcount?

Custom views, based on phase 1 model, required 2 weeks, creating cost-overhead and bottlenecks that could slow or derail product-led transformation efforts.

Our radical solution, pitched only weeks after VIBE coding's announcement in Feb. 2025: use AI to create custom analytics views!

Phase 2

Scaling personalization with AI

Phase 1's success brought new challenges: how to scale our source of truth without additional headcount?

Custom views, based on phase 1 model, required 2 weeks, creating cost-overhead and bottlenecks that could slow or derail product-led transformation efforts.

Our radical solution, pitched only weeks after VIBE coding's announcement in Feb. 2025: use AI to create custom analytics views!

Low-fidelity mocks of "Ask your portfolio"

Example of the phase 2 AI-enabled 360-degree source of truth wireframe

Architecture

Building for change

An intent-driven source-of-truth experience required, at a minimum, 2 things:

  1. A governance model that legal, security, architecture, and product could stand behind.

  2. A UI in which the AI augmented, rather than replaced the tools teams had come to rely on.

Architecture

Building for change

An intent-driven source-of-truth experience required, at a minimum, 2 things:

  1. A governance model that legal, security, architecture, and product could stand behind.

  2. A UI in which the AI augmented, rather than replaced the tools teams had come to rely on.

Low fidelity mock of the product analytics

Example of the high-level model used to communicate our AI governance strategy for the 360 Source of Truth.

The AI-augmented source of truth experience

Introducing AI at FINRA, especially after I'd just finished building FINRA's first AI-approvals process, meant I needed to pilot the frameworks for introducing AI to FINRA's mission-critical processes. This meant bi-weekly check-ins with executives while also demonstrating to teams the benefits of hypothesis-based design to ensure we remained focused, even as the technology rapidly evolved.

The AI-augmented source of truth experience

Introducing AI at FINRA, especially after I'd just finished building FINRA's first AI-approvals process, meant I needed to pilot the frameworks for introducing AI to FINRA's mission-critical processes. This meant bi-weekly check-ins with executives while also demonstrating to teams the benefits of hypothesis-based design to ensure we remained focused, even as the technology rapidly evolved.

Low fidelity mock of the product analytics

Example of the high-level wires used to communicate the alignment of phase 2's features with OKRs.