
$

40

B

Revenue between 2015-2016

$

40

B

Revenue between 2015-2016

400
770

%

Repeat purchase rate at 90 days

400
770

%

Repeat purchase rate at 90 days

3000

K

Shadow buyers converted in 8 weeks

3000

K

Shadow buyers converted in 8 weeks

2300

K

Healthcare practices unblocked through research

2300

K

Healthcare practices unblocked through research

Challenge

Amazon’s shopping systems were built for individual consumers, not businesses. Among other gaps, we lacked shared accounts, contract pricing, inventory and quality tracking, approval workflows, purchase orders, tax exemptions, bulk-order carts, drop shipping, and Prime content licensed for business use.

strategy

Working with buyers, I defined Amazon’s business purchasing experience and account structure. I then led procurement systems integration efforts and scaled our patterns across the rest of Amazon's product pages, account management, and checkout.

Results

Large companies could now use Amazon for operational purchases. Repeat purchases rose from 40% to 77%, while annual B2B revenue reached $3 billion. Our work reached 90% of product pages and changed how Amazon helped customers find, buy, and receive products.

Challenge

When "one-size-fits-all" fails.

Normally, Amazon bought companies for their inventory, then sold it through a retail experience built for small orders. Qualitative and quantitative research showed businesses used Amazon only for faster or cheaper spot purchases, not routine procurement. Without the product information and buying tools businesses needed, returns exceeded 10%. Our B2B redesign cut them to 6%.

Challenge

When "one-size-fits-all" fails.

Normally, Amazon bought companies for their inventory, then sold it through a retail experience built for small orders. Qualitative and quantitative research showed businesses used Amazon only for faster or cheaper spot purchases, not routine procurement. Without the product information and buying tools businesses needed, returns exceeded 10%. Our B2B redesign cut them to 6%.

"It feels like I'm shopping for airplane components at Toys R Us."

— Business buyer, Amazon Supply research session

Six weeks of field research showed that spot purchases made up less than 5% of monthly purchasing spend across businesses of every size. To compete for the other 95%, Amazon had to support routine procurement, including contract pricing, approvals, purchase orders, inventory planning, next-day delivery, and 365-day returns.

Recreation of the procurement swimlanes used to illustrate B2B scope
Strategy

A purchasing platform built around how businesses work.

My work on 3 tracks made Amazon viable for business purchasing:

  1. Redesigned shopping to reduce wrong orders and returns.

  2. Built accounts for 1–1,000+ buyers, with buyer and payment controls, manual or rules-based approvals, and purchasing visibility.

  3. Protected personal data while migrating 300,000+ accounts tied to work emails.

Strategy

A purchasing platform built around how businesses work.

My work on 3 tracks made Amazon viable for business purchasing:

  1. Redesigned shopping to reduce wrong orders and returns.

  2. Built accounts for 1–1,000+ buyers, with buyer and payment controls, manual or rules-based approvals, and purchasing visibility.

  3. Protected personal data while migrating 300,000+ accounts tied to work emails.

A purchasing experience built for professional evaluation

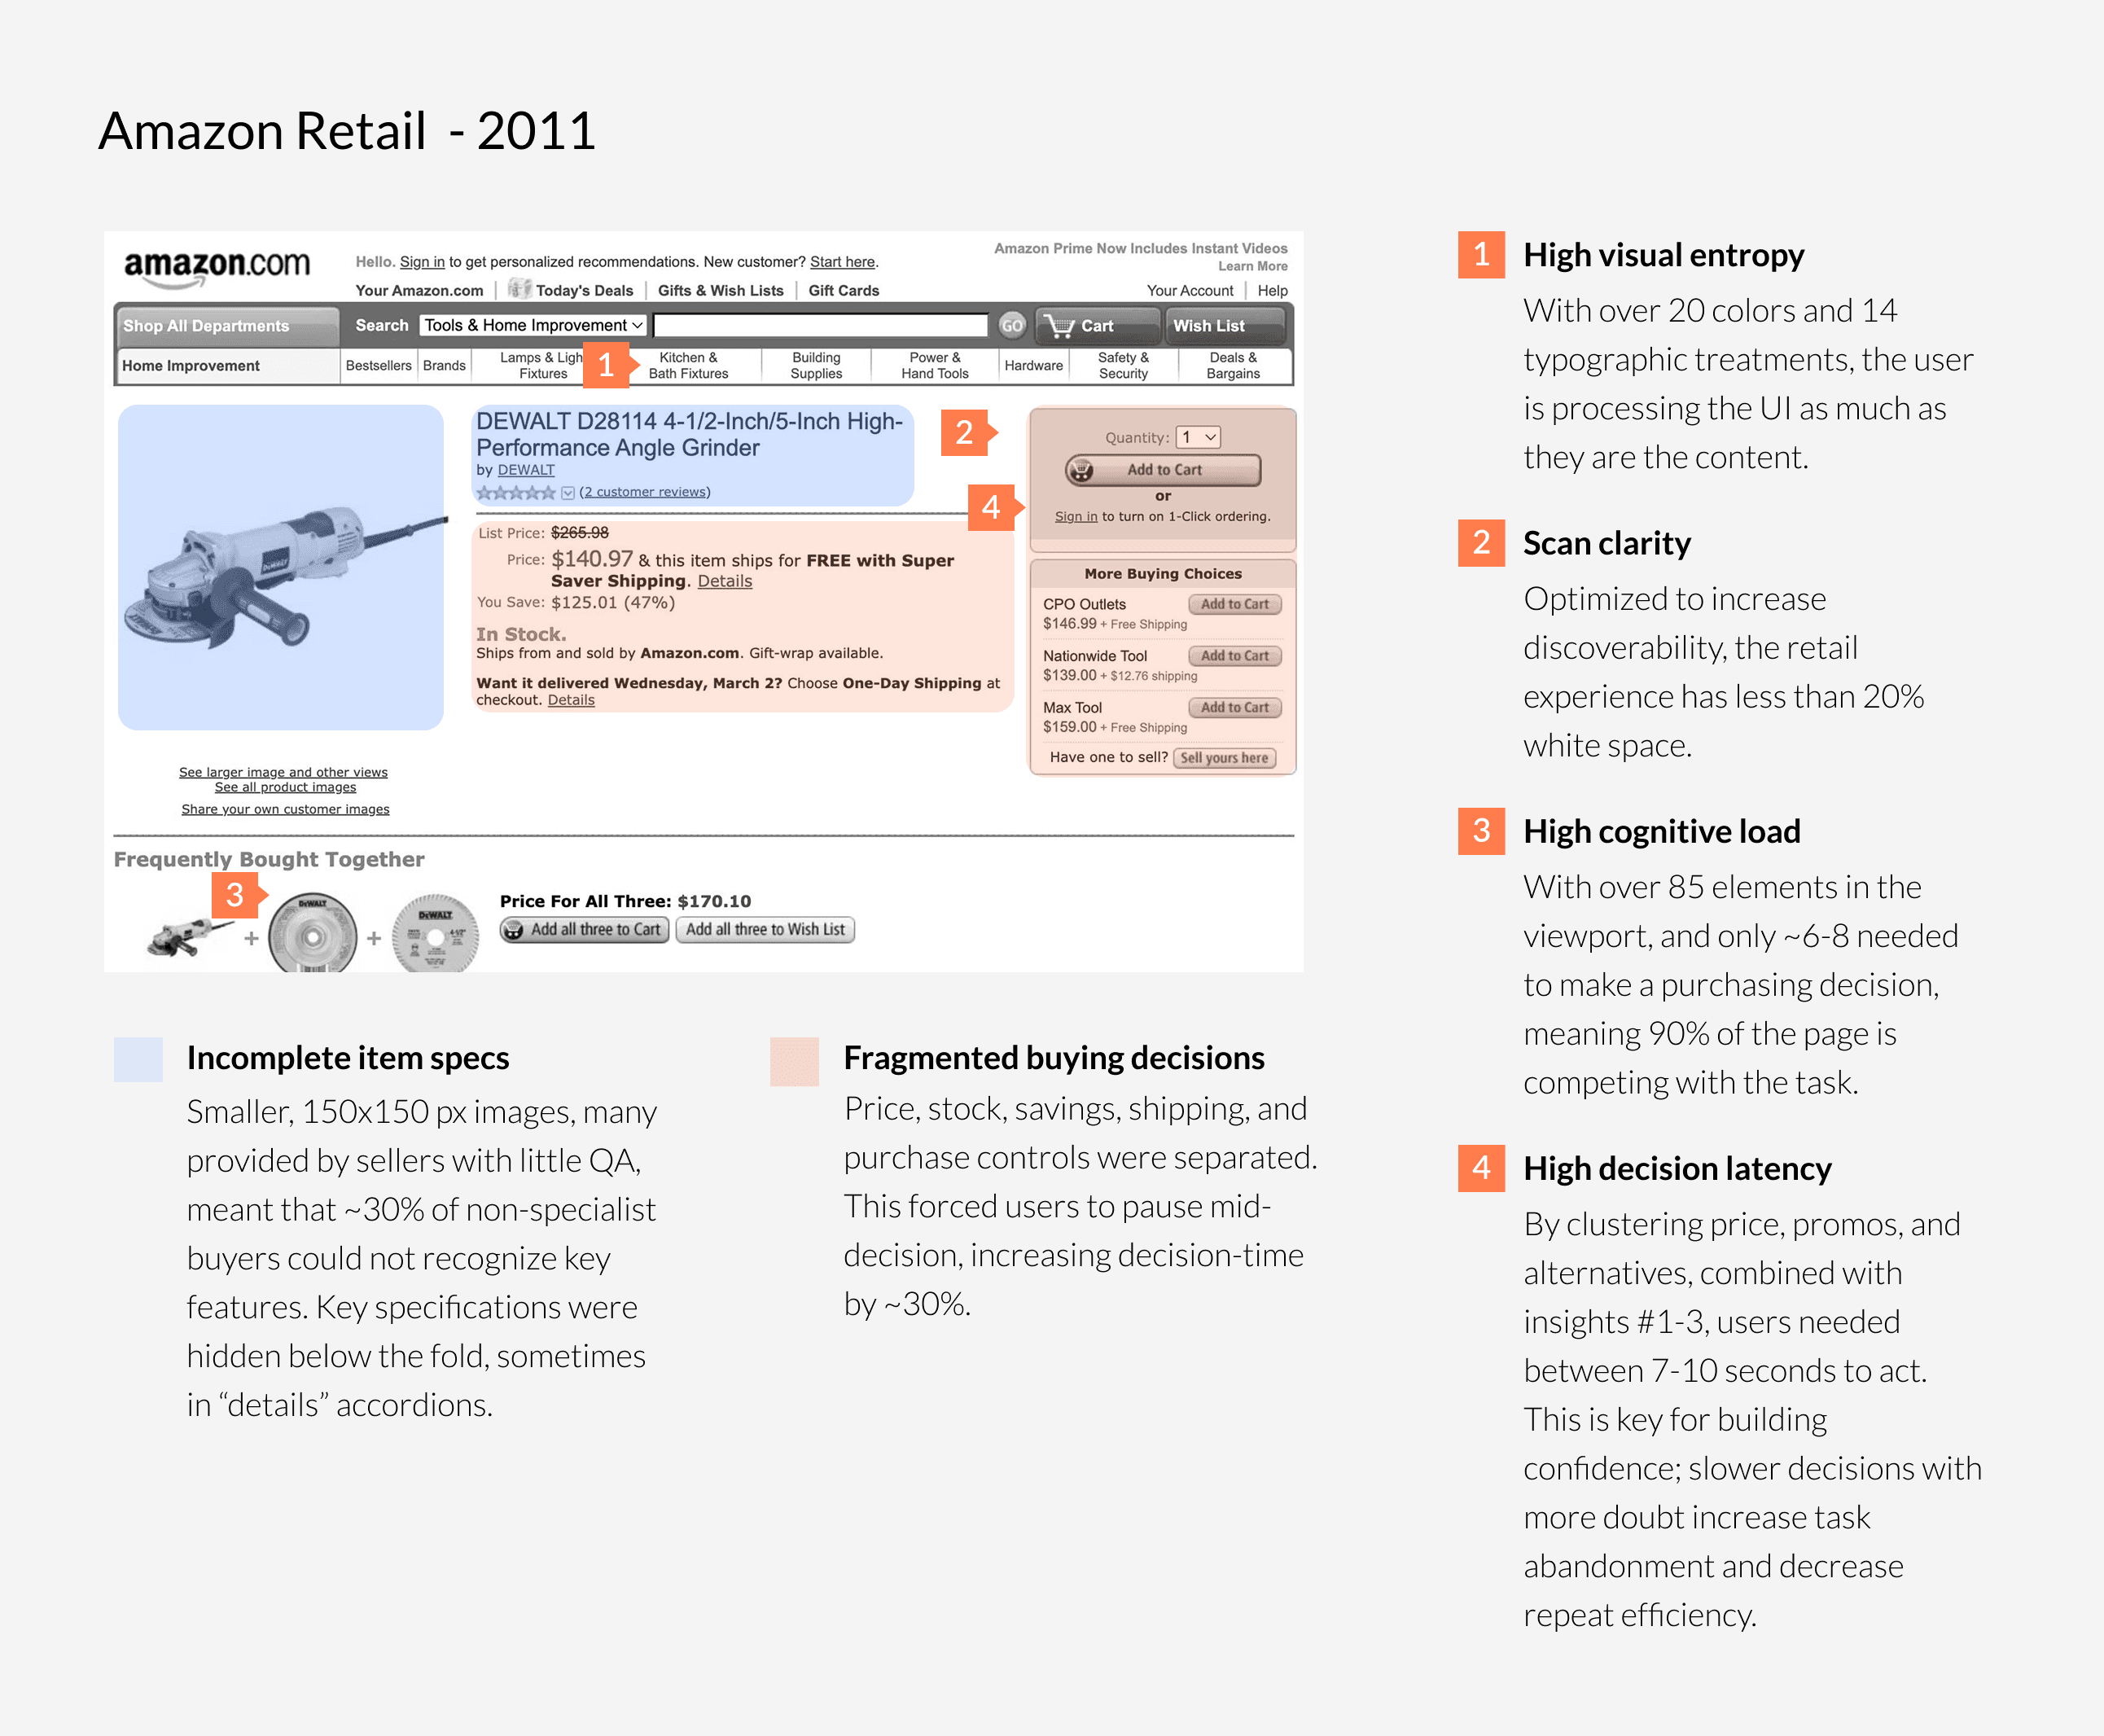
B2B buyers did not shop the way consumers browsed Amazon. Fasteners alone could have 50+ variations, yet the product page treated them almost identically.

I redesigned the experience around how professionals actually evaluated parts: 80% larger images, specification-first layouts, and comparison patterns built for operational purchasing.

Decision time dropped from 6–10 seconds to 3–5. Returns fell from 10% to 6%. Many of these patterns later spread across Amazon.

A purchasing experience built for professional evaluation

B2B buyers did not shop the way consumers browsed Amazon. Fasteners alone could have 50+ variations, yet the product page treated them almost identically.

I redesigned the experience around how professionals actually evaluated parts: 80% larger images, specification-first layouts, and comparison patterns built for operational purchasing.

Decision time dropped from 6–10 seconds to 3–5. Returns fell from 10% to 6%. Many of these patterns later spread across Amazon.

Side-by-side comparison of key features/patterns Amazon Retail and Amazon Supply browse patterns (2011)

Results

My resulting new B2B design patterns reduced returns by 40% (10→6%), and task completion times by 45% (9s→4s). The radical elimination of color from all but links and product images shocked many, but it performed so well that it later inspired Amazon's "beacon" retail redesign a year later.

Results

My resulting new B2B design patterns reduced returns by 40% (10→6%), and task completion times by 45% (9s→4s). The radical elimination of color from all but links and product images shocked many, but it performed so well that it later inspired Amazon's "beacon" retail redesign a year later.

Amazon - 2011
Amazon Supply

Side-by-side comparison of Amazon Retail and Amazon Supply (2011)

A scalable organizational account architecture

Amazon was built around one email and one account. Companies could not purchase that way. Before organizations could route orders through procurement systems, the underlying account model had to be rebuilt.

Working closely with legal, I helped architect the migration strategy to ensure employees’ personal purchase histories were never exposed to employers. In 8 weeks, 300K shadow business buyers either converted to or were merged into business accounts.

A scalable organizational account architecture

Amazon was built around one email and one account. Companies could not purchase that way. Before organizations could route orders through procurement systems, the underlying account model had to be rebuilt.

Working closely with legal, I helped architect the migration strategy to ensure employees’ personal purchase histories were never exposed to employers. In 8 weeks, 300K shadow business buyers either converted to or were merged into business accounts.

Example workflow illustrating the in-depth logic behind the registration/account merger process

Hard Decisions

Building an account model that could scale

Business Admin accounts: Launch fast or build what lasts?

Under pressure to launch, I made a difficult call with engineering: ship phase one using a hierarchical account model so we could uncover onboarding and support problems at scale while building the object-oriented version in parallel. Phase two is still in use today.

Hard Decisions

Building an account model that could scale

Business Admin accounts: Launch fast or build what lasts?

Under pressure to launch, I made a difficult call with engineering: ship phase one using a hierarchical account model so we could uncover onboarding and support problems at scale while building the object-oriented version in parallel. Phase two is still in use today.

Model comparison "white paper" circulated to inform phased account manager launch.

Restricted certifications

Don’t ask users for data we can verify ourselves

Healthcare providers originally had to upload photos of their licenses to create accounts. The result was catastrophic: 87% of registration attempts were abandoned.

Working with legal, I showed that almost all of the certification data being requested already existed in public records. We reduced physical proof requirements to the single state that legally required it. Average verification time dropped from 3 days to 15 minutes, unlocking 230K healthcare provider accounts.

Restricted certifications

Don’t ask users for data we can verify ourselves

Healthcare providers originally had to upload photos of their licenses to create accounts. The result was catastrophic: 87% of registration attempts were abandoned.

Working with legal, I showed that almost all of the certification data being requested already existed in public records. We reduced physical proof requirements to the single state that legally required it. Average verification time dropped from 3 days to 15 minutes, unlocking 230K healthcare provider accounts.

Example flow diagram illustrating the steps, processes, times, and emotional impact of our restricted & regulated (R&R) product certification.

Results

A new standard for Amazon

Large organizations could now place operational orders through Amazon. The patterns we built for professional buyers were later formalized into the Business Interface Guidelines and spread across Amazon’s broader shopping experience, influencing browse, search, and ordering patterns across the catalog.

More than 100 of the patterns I developed still live on at Amazon, including the inline image filter I created, which reduced load overhead by 80% and later became a standard search feature. Phase two of the account architecture is still in use today.

Results

A new standard for Amazon

Large organizations could now place operational orders through Amazon. The patterns we built for professional buyers were later formalized into the Business Interface Guidelines and spread across Amazon’s broader shopping experience, influencing browse, search, and ordering patterns across the catalog.

More than 100 of the patterns I developed still live on at Amazon, including the inline image filter I created, which reduced load overhead by 80% and later became a standard search feature. Phase two of the account architecture is still in use today.

Accounts
2000

K

10

M

Accounts were activated during year 2 through onboarding efforts.

Accounts
2000

K

10

M

Accounts were activated during year 2 through onboarding efforts.

B2B Scope
900

%

% of Amazon's catalog covered by B2B design patterns

B2B Scope
900

%

% of Amazon's catalog covered by B2B design patterns

Shopping Behavior
400
770

%

Repeat purchase rate at 90 days using history/peer activity

Shopping Behavior
400
770

%

Repeat purchase rate at 90 days using history/peer activity

Revenue

$

40

B

$1B in annual revenue in year 1, $3B in year 2.

Revenue

$

40

B

$1B in annual revenue in year 1, $3B in year 2.